1. Literature Search
We first searched the PubMed database to obtain publications related to congenital heart disease (CHD) using the query term as follows:
(congenital heart disease*[All Fields] OR heart defect*[All Fields] OR transposition of the great arteri*[All Fields] OR pulmonary atresia[All Fields] OR pulmonary artery atresia[All Fields] OR Anomalous pulmonary venous*[All Fields] OR Ebstein anomaly[All Fields] OR Epstein anomaly[All Fields]) AND (gene[Title/Abstract] AND (proteomics[Title/Abstract] OR expression[Title/Abstract] OR CNV[Title/Abstract] OR copy number variation[Title/Abstract] OR microarray*[Title/Abstract] OR microdel*[Title/Abstract] OR microdup*[Title/Abstract] OR rearrange*[Title/Abstract] OR linkage[Title/Abstract] OR associa*[Title/Abstract] OR scan[Title/Abstract] OR sequenc*[Title/Abstract])) AND ("1000/01/01"[Date - Publication]: "2020/01/10"[Date - Publication])
The abstracts of 2762 publications retrieved were scrutinized to remove irrelevant papers, and the remaining 1114 publications were systematically reviewed.
2. Data Collection
For each qualified study, items of research evidence were retrieved. According to the strategy of studies, we classified research evidence into the following groups: “Genetic association”, “SNV/Indel”, “Expression”, “Linkage”, “CNV” and “Other” evidence. For example, “SNV/Indel” evidence is retrieved from sequencing studies reporting single-nucleotide variants/insertion-deletion variants (SNVs/Indels) in patients. “CNV” evidence is mainly from microarray studies reporting copy number variations (CNVs) in patients. “Other” evidence is mainly from functional analysis in cell culture and animal model studies. If multiple experimental methods or different datasets were used in one study, the evidence of this study was divided into multiple independent items. For example, if an association study was performed in a discovery cohort and validated significant findings in a replication cohort, two pieces of “Genetic association” evidence were collected from the two cohorts. If a sequencing study identified SNVs/indels in patients and then conducted functional analysis for the candidate gene in animal model, we collected one piece of “SNV/Indel” evidence and one piece of “Other” evidence. According to each type of evidence, comprehensive meta-data was collected. If the study reported variations in patients, we further collected the detailed phenotypes of variation carriers. Please note only carriers presenting CHD were included in CHDbase. A detailed description of the collected information is listed in Table 1.
The disease name was standardized according to the 11th revision of the International Classification of Diseases (ICD-11) congenital cardiology terms. Transcript-based SNVs/Indels were annotated by Ensembl Variant Effect Predictor (VEP) and confirmed by Mutalyzer following the nomenclature recommendations of the Human Genome Variation Society (HGVS). Genomic coordinates are provided according to the human reference genome (GRCh37/hg19).
Table 1 Collected information for different types of evidence
| Genetic Association | SNV/Indel | Expression | Linkage | CNV | Other | ||
|---|---|---|---|---|---|---|---|
| Publication | First author | ✔ | ✔ | ✔ | ✔ | ✔ | ✔ |
| Title | ✔ | ✔ | ✔ | ✔ | ✔ | ✔ | |
| Year of publication | ✔ | ✔ | ✔ | ✔ | ✔ | ✔ | |
| Journal | ✔ | ✔ | ✔ | ✔ | ✔ | ✔ | |
| PubMed ID | ✔ | ✔ | ✔ | ✔ | ✔ | ✔ | |
| Abstract | ✔ | ✔ | ✔ | ✔ | ✔ | ✔ | |
| Summary | ✔ | ✔ | ✔ | ✔ | ✔ | ✔ | |
| Population | Species | ✔ | ✔ | ✔ | ✔ | ✔ | ✔ |
| Ethnicity | ✔ | ✔ | ✔ | ✔ | ✔ | ✔ | |
| Country of origin | ✔ | ✔ | ✔ | ✔ | ✔ | ✔ | |
| Number of families, cases and controls | ✔ | ✔ | ✔ | ✔ | ✔ | ✔ | |
| Male/female ratio of cases and controls | ✔ | ✔ | ✔ | ✔ | ✔ | ✔ | |
| Age of cases and controls (mean, sd, range) | ✔ | ✔ | ✔ | ✔ | ✔ | ✔ | |
| Diagnosis of cases | ✔ | ✔ | ✔ | ✔ | ✔ | ✔ | |
| Other phenotype of cases | ✔ | ✔ | ✔ | ✔ | ✔ | ✔ | |
| Animal/cell model | ✔ | ||||||
| Study design | Study type | ✔ | ✔ | ✔ | ✔ | ✔ | ✔ |
| Experimental method/platform | ✔ | ✔ | ✔ | ✔ | ✔ | ✔ | |
| Statistical method | ✔ | ✔ | ✔ | ||||
| Results | Variation/region/gene | Reported SNPs | Reported SNVs/Indels | Reported gene | Reported linkage regions | Reported CNVs | Reported gene/translocations |
| Evaluation parameters | Allele and genotype distribution (Number, Frequency) | Number of independent carriers in cases and controls | Up or down regulated | Significant markers | Number of independent carriers in cases and controls | ||
| Statistical significance and findings | P value, OR, RR, 95%CI for allele and/or genotype comparison | Pathogenicity classification based on authors’ conclusion | Fold change, P value |
LOD, NPL, P value | Pathogenicity classification based on authors’ conclusion | Result summary | |
| Associated CHD | ✔ | ✔ | ✔ | ✔ | ✔ | ✔ | |
| Associated Syndrome | ✔ | ✔ | ✔ | ✔ | ✔ | ✔ | |
| Sample | Family ID | ✔ | ✔ | ✔ | |||
| Sample ID | ✔ | ✔ | ✔ | ||||
| Gender | ✔ | ✔ | ✔ | ||||
| Age | ✔ | ✔ | ✔ | ||||
| Diagnosis | ✔ | ✔ | ✔ | ||||
| Other phenotypes | ✔ | ✔ | ✔ | ||||
| Transmission (de novo, paternal, maternal, familial) | ✔ | ✔ | ✔ | ||||
| Zygosity (homozygous, heterozygous, mosaic) | ✔ | ✔ | ✔ |
3. CHD-related Gene Prioritization
In CHDbase, 1124 genes have been reported to increase susceptibility to CHD. For these CHD-related genes, we constructed an unweighted network based on the experimentally-verified protein–protein interactions from the STRING database (https://string-db.org/). In the network, the two genes were connected with an edge only when the STRING experimental score > 0. Degree, betweenness centrality and eigenvector centrality are used to measure the significance of each gene in the network. To obtain the core gene set with high importance, we obtained a k-core with 163 genes and 7925 edges from the network with k-core decomposition. These 163 genes with a maximum value of k (k = 70) are considered as the most centrally located nodes in the original network.
4. Functional Annotations
4.1 Gene Annotation
To facilitate users to better understand the function of genes, we annotated them using public databases and data as follows and provide the information on the Gene Annotation Page.
4.1.1 Phenotype
Information for gene-related human phenotypic abnormalities and diseases was collected from Human Phenotype Ontology (HPO, Version: Jan 8, 2019), GWAS Catalog (downloaded from UCSC on May 29, 2020) and DisGeNET (v7.0).
4.1.2 Expression
Spatiotemporal gene expression levels were integrated from the latest gene expression data as follows: 1) RNA-Seq data generated by the genotype-tissue expression (GTEx) project for 31 human tissues, including adipose, adrenal gland, artery, bladder, brain, breast, cell lines, cervix, colon, esophagus, fallopian tube, heart, kidney, liver, lung, minor salivary gland, muscle, nerve, ovary, pancreas, pituitary, prostate, skin, small intestine, spleen, stomach, testis, thyroid, uterus, vagina, and whole blood; 2) RNA-Seq data published by Cardoso-Moreira et al. for seven human organs (cerebrum, cerebellum, heart, kidney, liver, ovary and testis) across multiple developmental time points; and 3) spatial subcellular expression data published by Asp et al. for the developing human heart at three developmental phases, namely, 4.5-5, 6.5 and 9 weeks post conception.
4.1.3 Post-Translational Modification (PTM)
PTM is the chemical modification of an amino acid on the protein or peptide after translation. We collected PTM data from UniProt (downloaded on May 29, 2020) and dbPTM (08 January 2019).
4.1.4 Gene Ontology (GO)
GO terms were parsed from the NCBI gene2go.gz file (May 5, 2020), including three categories, biological process, molecular function and cellular component.
4.1.5 Pathway
The biological pathways in which genes are involved were integrated from four databases: Reactome download from UniProt (release 2020_06), BioCyc (v22.0), KEGG download from KOBAS (v3.0.3), and PANTHER (v3.6.4).
4.1.6 Interaction
Molecular interactions were retrieved from the STRING (V11.0), OmniPath (April 15, 2020), BioGRID (V3.5.185) and human reference interactome (HuRI) databases. In the STRING dataset, the red node represents the quality score of the evidence, the color gradient of which is proportional to the quality: the darker the color, the higher the quality. The OmniPath interactions downloaded from the webserver (https://archive.omnipathdb.org) include not only omnipath data but also pathwayextra, kinaseextra, ligrecextra, and tfregulons data. The action, direction, and evidence of the interaction are provided. The BioGRID dataset contains protein, genetic, and chemical interactions (Homo sapiens). The HuRI dataset includes all protein–protein interactions identified in HI-I-05, HI-II-14, HuRI, Venkatesan-09, Yu-11, Yang-16, and test space screens-19.
4.1.7 Drug
To facilitate the identification of clinically relevant drugs, we also collected gene–drug interactions from DGIdb (v3.0), DrugCentral (v2020), and PharmGKB (Oct, 2012). The drug name, interaction type, evidence and reference are provided.
4.2 Variation Annotation
We provide comprehensive functional annotations for SNVs/Indels on the "Variation Annotation" page, including related gene, variant type, ID of other existing databases such as dbSNP and ClinVar, allele frequency in different populations of gnomAD, conservation scores calculated with phastCons, phyloP, and GERP++, and deleteriousness predicted by SIFT, PolyPhen, CADD, DANN, LRT, M-CAP, MetaLR, PrimateAI, fathmm-MKL, and fathmm-XF at transcript level.
5. Search
We provides two search modes for users to retrieve data of interest from CHDbase. The usage of basic and advanced search functions will be introduced.
5.1 Basic Search
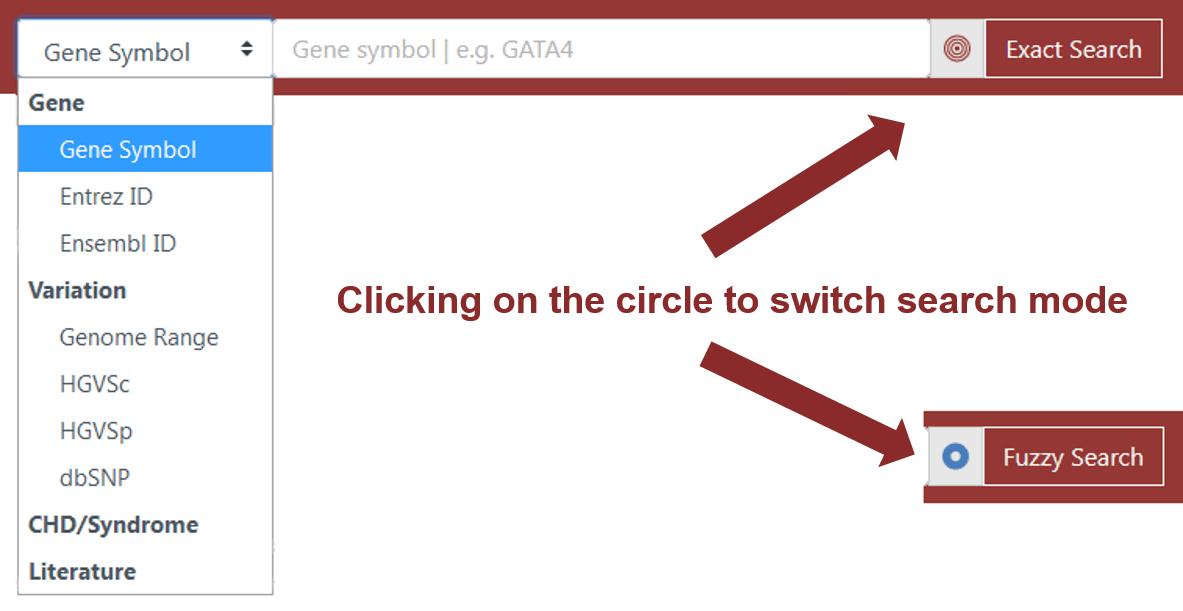
Figure 1 Search box on the Home Page and top navigation bar
Table 2 Format of search terms for basic search mode
| Term | Exact Search | Fuzzy Search |
|---|---|---|
| Gene Symbol | Official gene symbol, e.g. GATA4 | Partial official gene symbol, e.g. GATA |
| Entrez Gene ID | [0-9], e.g. 2626 | Partial Entrez Gene ID, e.g. 26 |
| Ensembl ID | [ENSG*], e.g. ENSG00000136574 | Partial Ensembl ID, e.g. ENSG00000136 |
| Genome range | [chr*:start-end], e.g. chr9:133738277-133738277 | [chr*:start-end], e.g. chr9:133738277-133738277 |
| HGVSc | [NM_*.*:c*], e.g. NM_005157.6:c.677A>G | Partial HGVSc expression, e.g. NM_005157.6:c.677A, but at least including transcript name with version and ":c", e.g. NM_005157.6:c |
| HGVSp | [NP_*.*:p*], e.g. NP_001123517.1:p.Gly112Arg | Partial HGVSp expression, e.g. NP_001123517.1:p.Gly, but at least including protein name with version and ":p", e.g. NP_001123517.1:p |
| dbSNP | [rs*], e.g. rs114390380 | Partial dbSNP ID, but at least starting with "rs" and including one digit, e.g. rs1 |
| CHD/Syndrome | Full name or abbreviation, e.g. Mitral atresia or MA | Partial full name or abbreviation |
| Literature | PubMed ID, e.g. 21815254 | Partial PubMed ID |
The basic search mode is provided on the Home Page and top navigation bar. Search terms such as gene symbols, Entrez IDs, Ensembl IDs, the range of genomic coordinates, HGVS expression at the cDNA level (HGVSc), HGVS expression at the protein level (HGVSp), dbSNP IDs, the full name or abbreviation of diseases, and PubMed IDs can be recognized by the basic search engine. The user can click on the circle at the end of the search box to choose "Exact Search" or "Fuzzy Search" mode (Figure 1). In the "Exact Search" mode, users need to enter a complete query term in valid format (Table 2). When searching for genes or variations, if CHDbase finds an exact match, the target Gene or Variation Evidence Page will be returned. Otherwise, the Browse Page will be redirected to facilitate users to retrieve the data of interest. When searching for diseases or literature, the query results will be returned on the Browse Page, and users can further review the details.
In the "Fuzzy Search" mode, users only need to enter the partial query term (Table 2). For example, if a user wants to search for the information about the variations on NM_005157.6 transcript, "NM_005157.6:c" can be input for HGVSc to fuzzily search. Please note for genome range query, if "chr9:1234567-2345678" is entered and "Exact Search" selected, the variation exactly mapped onto the corresponding positions will be returned. If "Fuzzy Search" is selected, the variations with start position ≥ chr9:1234567 and end position ≤ chr9:2345678 will be returned.
5.2 Advanced Search
To help users retrieve data more flexibly, we also provide table browser at the gene level and variation level on the Browse Page. Users can click on the "Browse" menu and then choose the browse level (Figure 2). When browsing at the gene level, evidence for the gene of interest can be obtained (Evidence ID starting with "CHDGE"). When browsing at the variation level, evidence for the variation of interest is obtained (Evidence ID starting with "CHDVE").
On the Browse Page, users can click on "Show/hide columns" button to show specific columns of interest; enter multiple query terms in the search boxes under the corresponding columns for advanced search; click on the up/down arrows on the right of column names to sort the table or use “Multiple sort” tool to sort it by multiple columns in a customized order (Figure 2). The crosslinks in the table browser can enable users to view the detailed information on Gene or Variation Evidence Page. Finally, users can click on "Export data" button to download the table in JSON or CSV format.
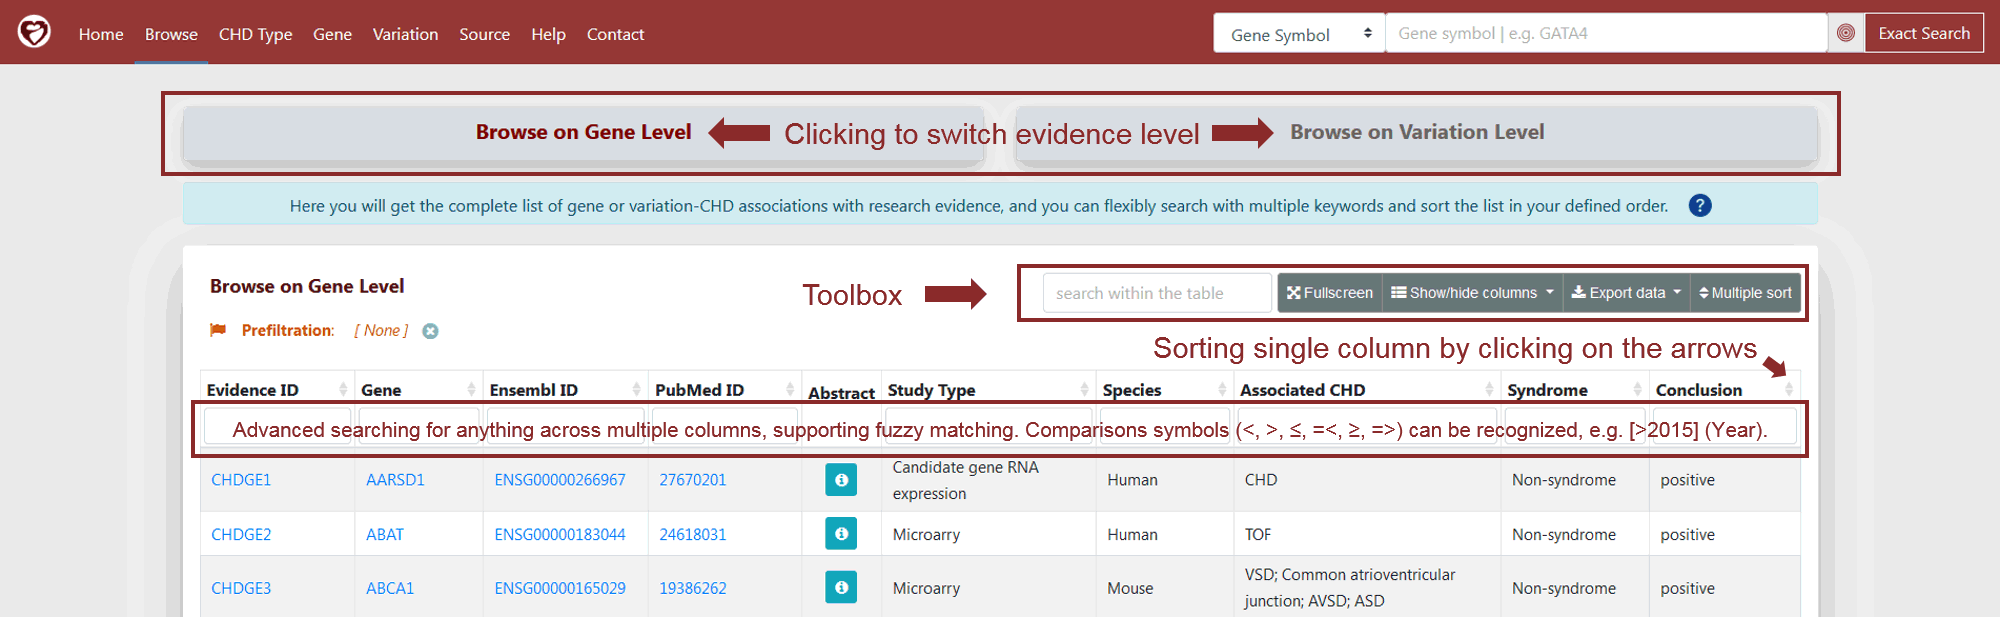
Figure 2 Browse Page with embedded toolbox for advanced search
6. Data Presentation
CNVs and linkage regions associated with diseases typically cover numerous genes, making it difficult to identify true causal genes. We thus do not provide the Evidence Page and Annotation Page for the genes only supported by “CNV” and/or “Linkage” evidence.
6.1 Evidence Page
Detailed information about evidence at the gene level and variation level is provided in a similar manner on the Gene and Variation Evidence Pages, respectively. Taking Gene Evidence Page as an example, the evidence list is shown in the upper panel. "Conclusion" column indicates whether the evidence supports the association of the gene with CHD. “Associated CHD” and “Syndrome” columns help users understand to which CHD types and syndromes this gene has been linked. “Associated CHD” generally integrates the diagnosed CHD and accompanying CHD reported in other phenotypes of patients, unless the authors clearly concluded that the gene is specifically related to some CHD types. “Syndrome” is from the diagnosed syndromes of patients with CHD. If users click on the "Detail" button before the Evidence ID, the evidence details are shown in the lower panel.
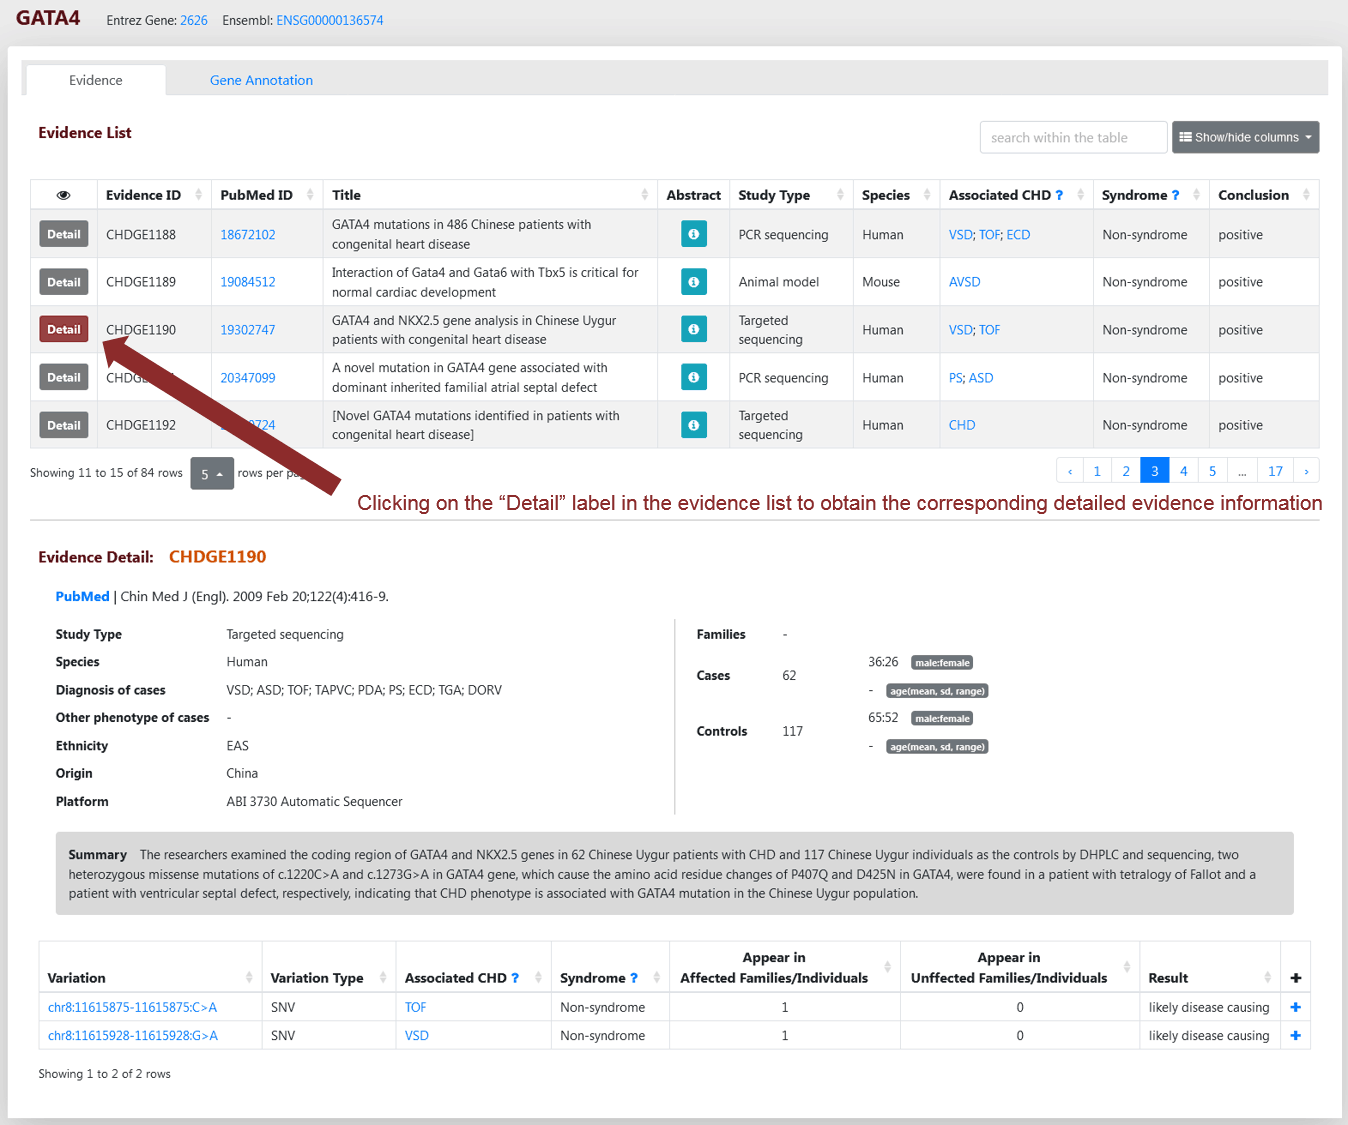
Figure 3 Gene Evidence Page
6.2 Annotation Page
To view functional annotations about genes, users can click on the label of “Gene Annotation” in the top left. The section of "Basic gene information" includes official symbols, aliases, full gene names, functional summary and crosslinks to other databases, such as HGNC, NCBI Entrez Gene, Ensembl, Genecards, OMIM, UniProt, Mouse Genome Informatics (MGI), and Zebrafish Model Organism Database (ZFIN) (blue buttons), for the convenience of users (Figure 4). Furthermore, functional information and data, including gene–phenotype associations, spatiotemporal gene expression profiles, PTMs, GO terms and biological pathways in which the genes are involved, protein–protein interactions, and gene–drug interactions, are available to facilitate in-depth investigation (Figure 4).
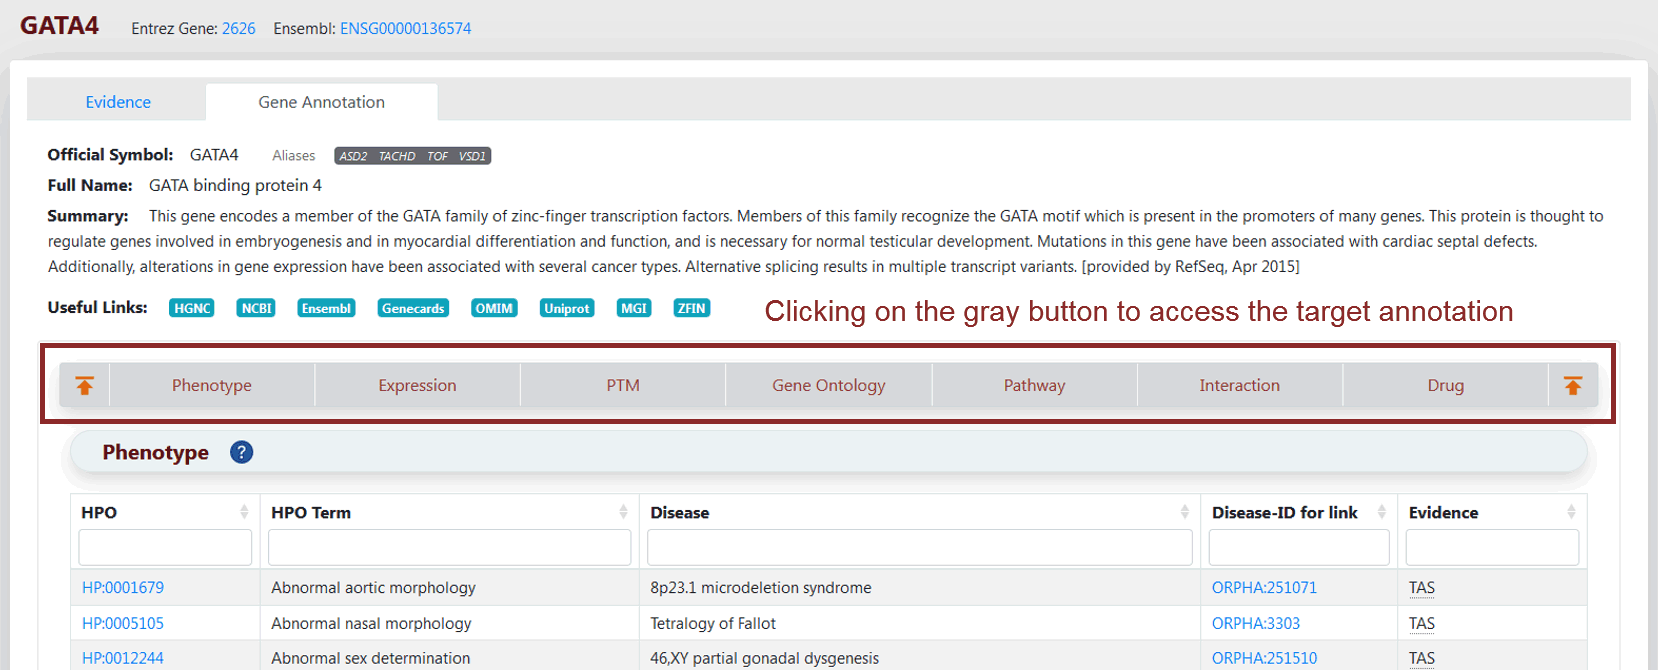
Figure 4 Gene Annotation Page
On the Variation Page, users can also click on the label of “Variation Annotation” in the top left to view the annotations for SNVs/Indels, including variant consequences, allele frequencies in different populations of gnomAD, conservation scores, and variant predicted deleteriousness (Figure 5).
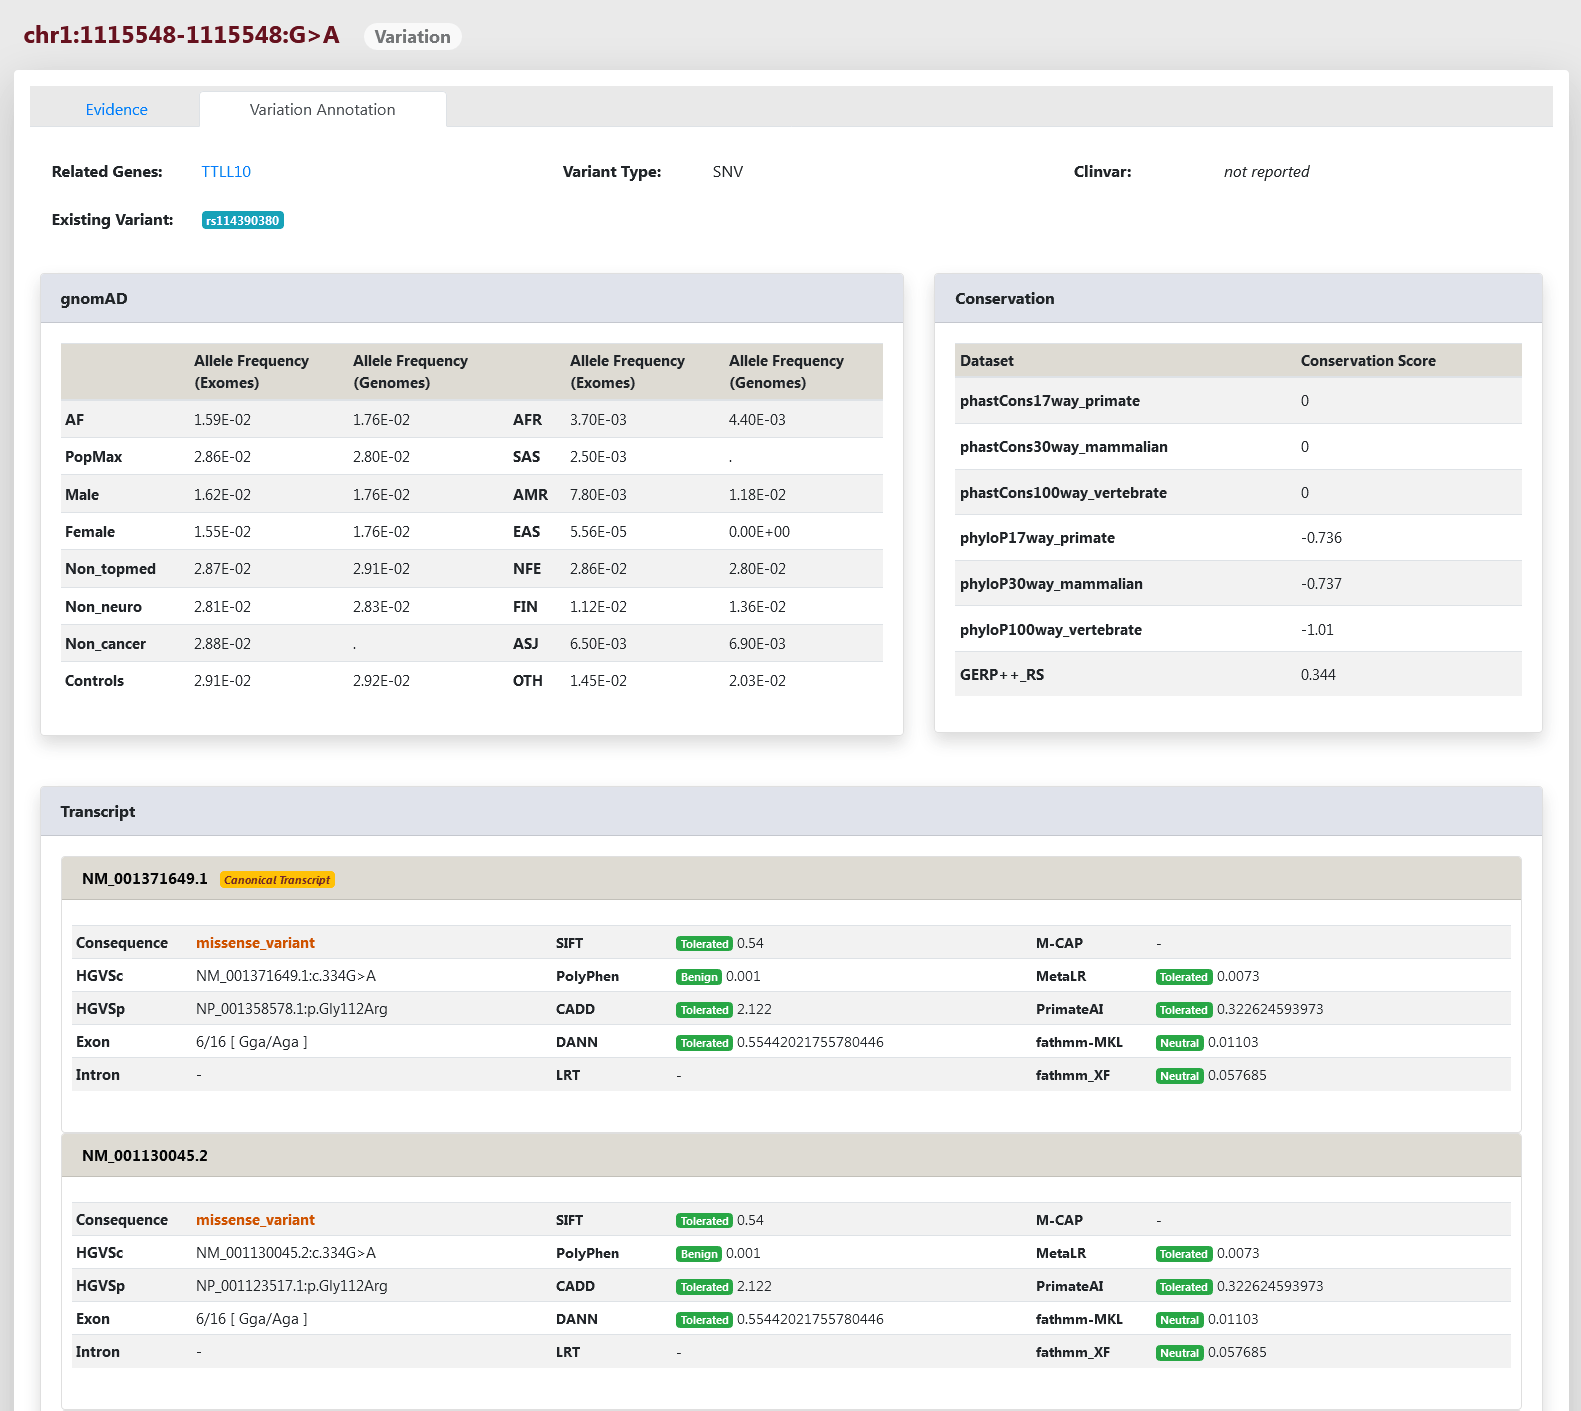
Figure 5 Variation Annotation Page
6.3 Statistics
6.3.1 CHD Type Page
In CHDbase, collected genotype–phenotype associations totally link to ~150 CHD types and 160 related syndromes. The top 52 CHD types ranked by the number of publications reported are shown in the bar plot first (Figure 6). Besides the number of publications, the number of genes reported only in syndromic CHD, reported only in nonsyndromic CHD and reported both in syndromic and nonsyndromic CHD are also provided for each CHD type. Users can click on the bar to view the details on the Browse Page.
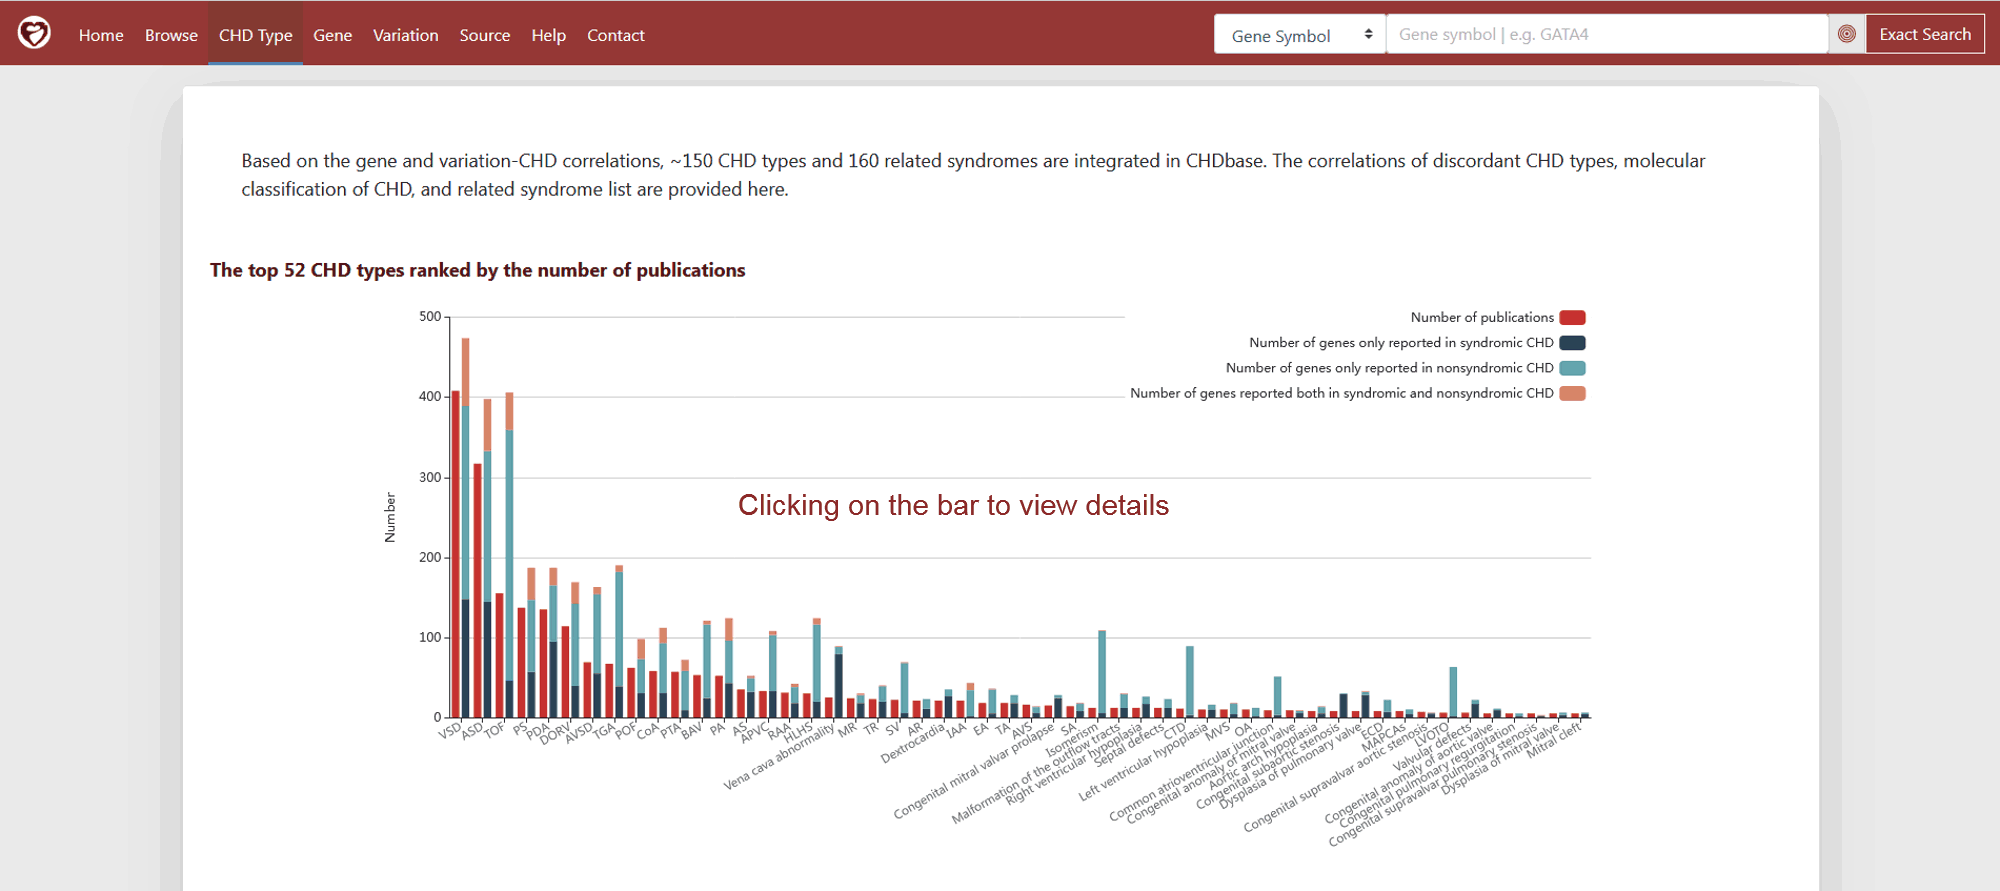
Figure 6 The top 52 CHD types ranked by the number of publications on CHD Type Page
For 27 CHD types associated with at least ten genes in CHDbase, the pairwise correlations were calculated using the Jaccard coefficient. It is a measure of similarity for the genes between two CHD types, ranging from 0 to 1. The number of overlapping genes, the number of genes for each CHD type, Jaccard coefficient, Jaccard distance, statistical significance are shown in the table (Figure 7). The value of the "Statistics" column is the centered Jaccard coefficient, which equals the Jaccard coefficient minus the unbiased estimation of expectation. P values were calculated with the Jaccard test and corrected for multiple testing using the Benjamini–Hochberg false discovery rate. Based on the pairwise Jaccard distance, which equals 1 minus Jaccard coefficient, 27 CHD types were classified into seven major groups using hierarchical clustering analysis. The matrix of pairwise Jaccard distances and the clustering result are shown in the heatmap (Figure 7).
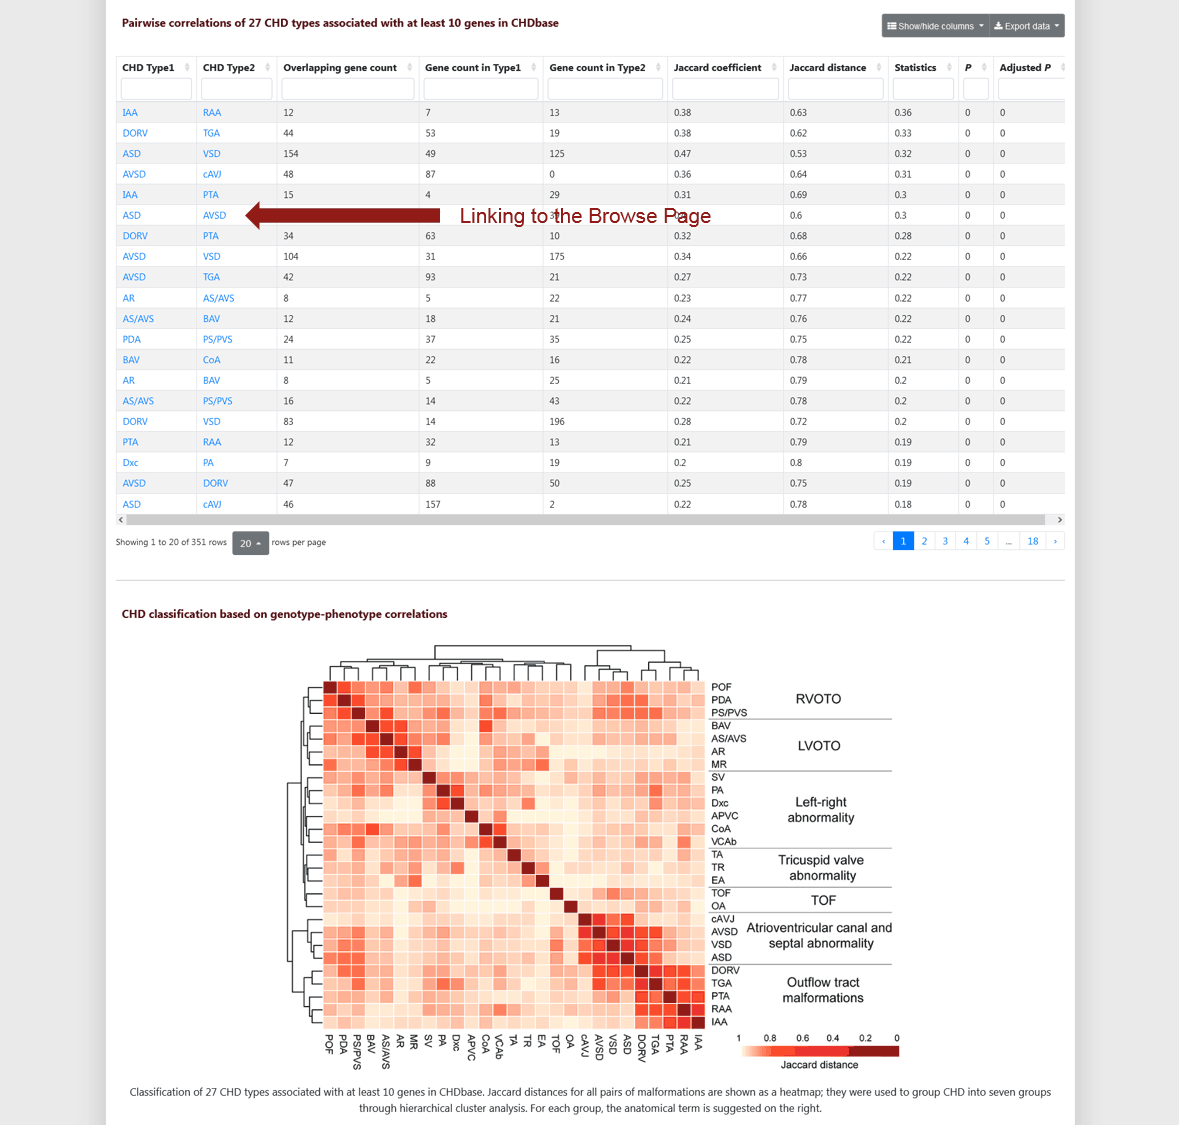
Figure 7 Pairwise correlations and classification of 27 CHD types on CHD Type Page
Finally, the list of 160 CHD-related syndromes with specific cardiac features, other clinical findings, and OMIM links is provided (Figure 8) . These syndromes are categorized into five groups according to the occurrence frequency of CHD in the syndrome: very commonly associated (CHD frequency ≥ 50%), frequently associated (CHD frequency ≥ 20% and CHD frequency < 50%), occasionally associated (CHD frequency ≥ 5% and CHD frequency < 20%), and very occasionally associated (CHD frequency < 5%).
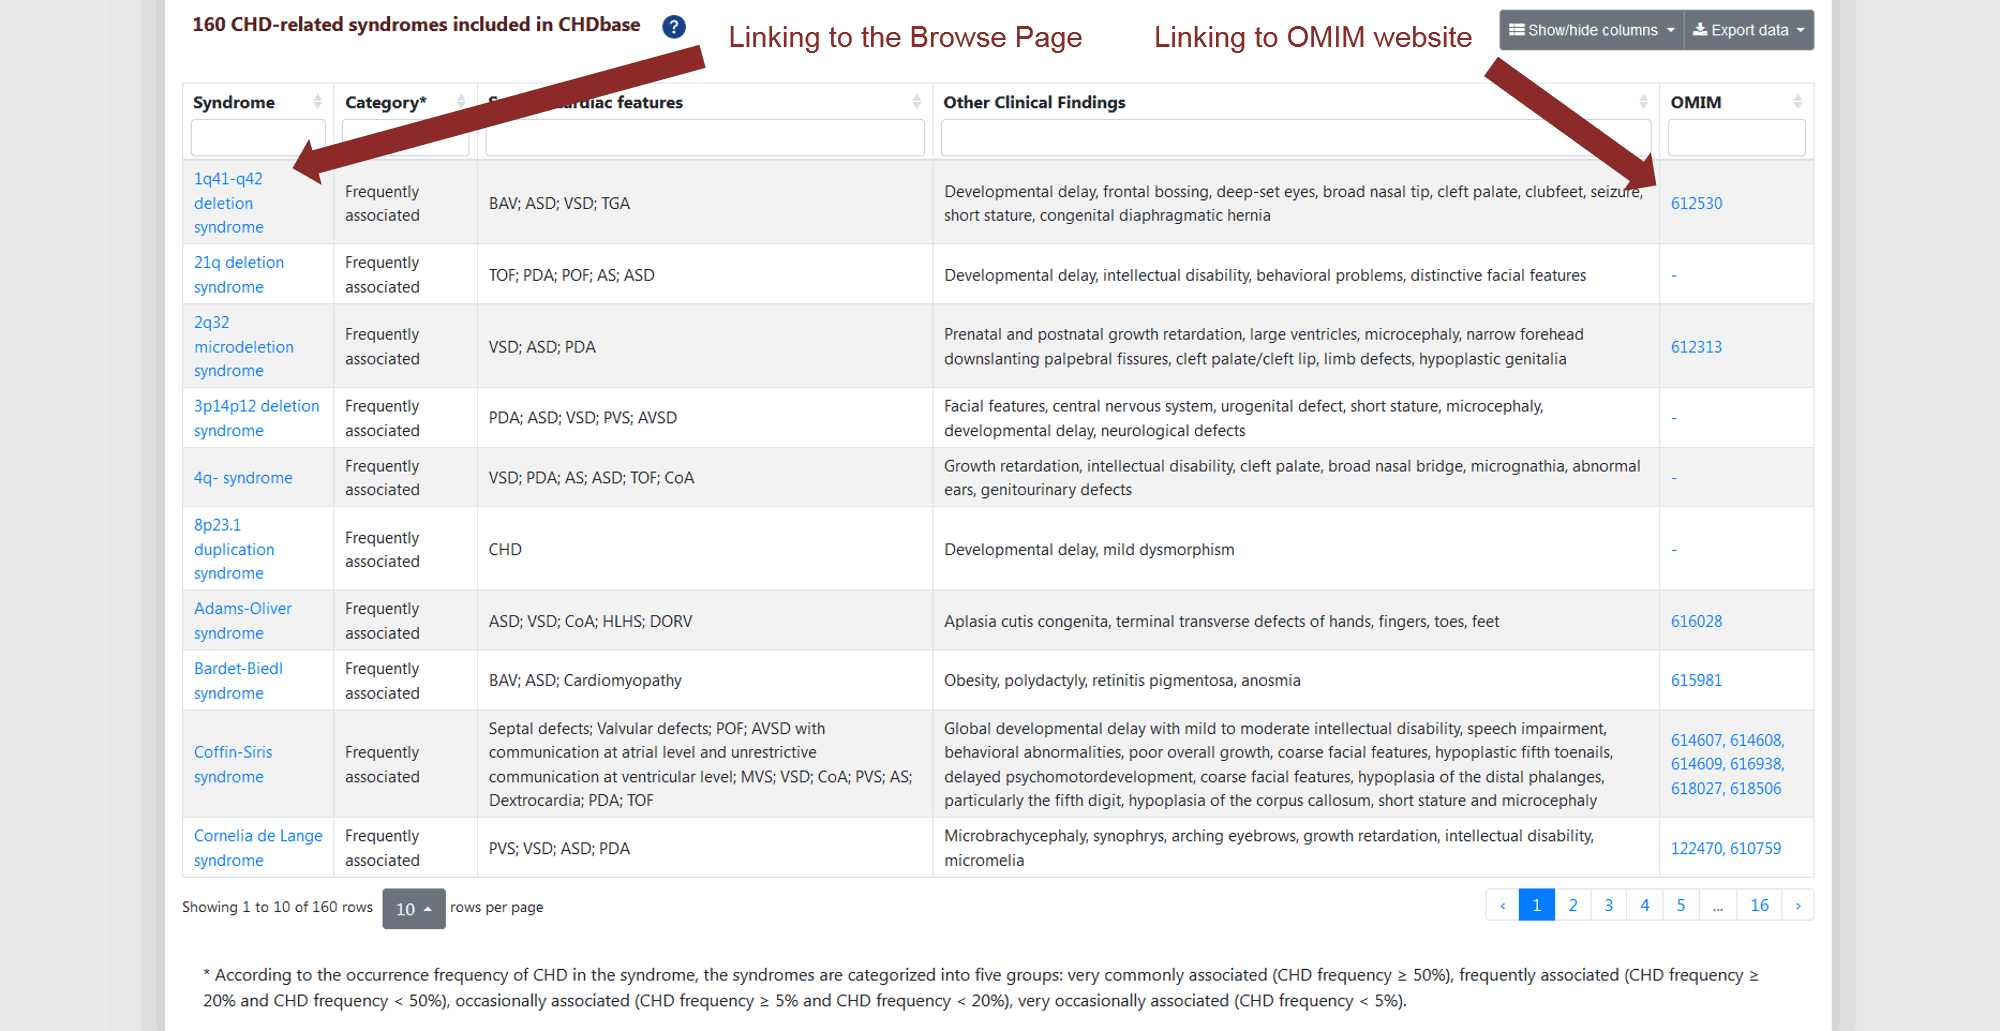
Figure 8 List of 160 CHD-related syndromes on CHD Type Page
6.3.2 Gene Page
As mentioned in the section of “CHD-related Gene Prioritization”, we prioritized the 1124 CHD-related genes using a gene interaction network approach and extracted a core sub-network of 163 genes. To facilitate users to rank genes based on their own experiences and preferences, CHD-related genes with the meta-data, such as the information indicating whether it belongs to the core gene set, its centrality scores, and the number of evidence items supporting its association with CHD are provided on the Gene Page (Figure 9). The expression profile and functional enrichment of CHD-related genes are also shown.
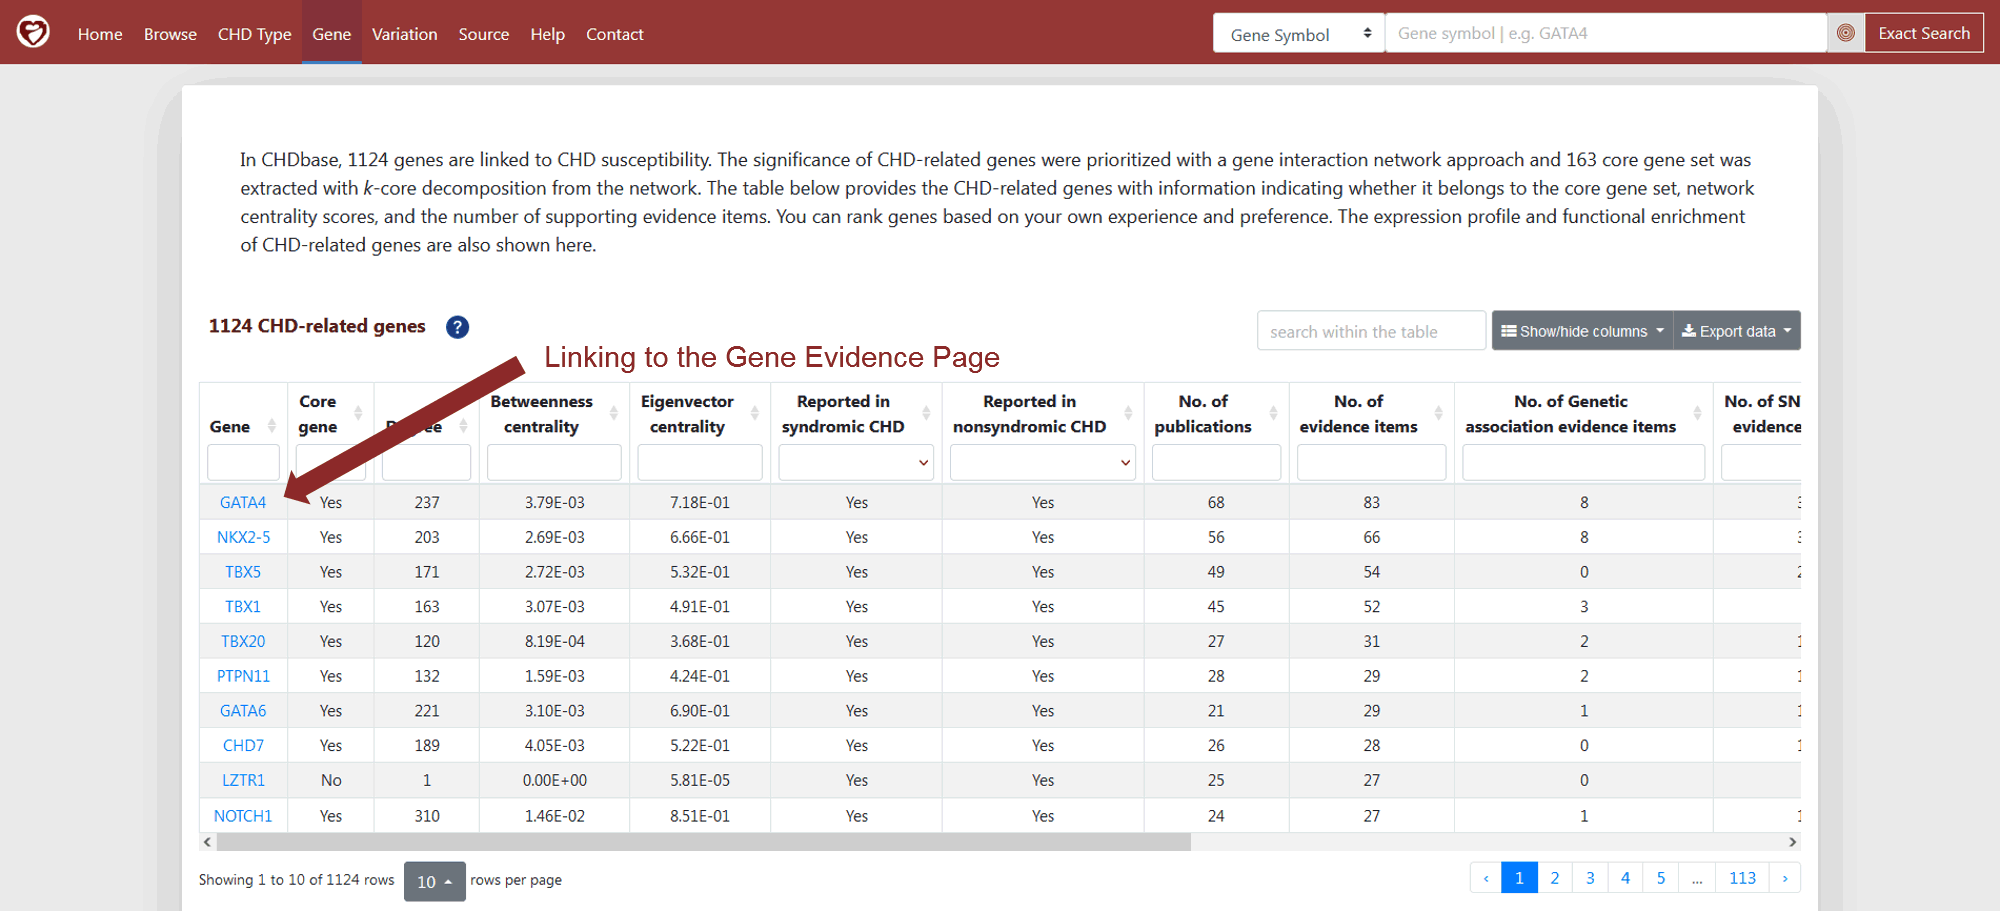
Figure 9 1124 CHD-related genes with core gene identity, network centrality scores and number of supporting evidence items
6.3.3 Variation Page
A total of 1006 structural variations and 2585 SNVs/Indels are included in CHDbase. On the Variation Page, the histogram in the upper panel shows the number of variations grouped by different types as annotated by the Ensembl Variant Effect Predictor (VEP) (Figure 10). Users can click on the bar to view the details on the Browse Page. The table in the lower panel lists the number of variations grouped by gene and variation type (Figure 10). If one variation is annotated as different types on different transcripts, the variation number of each corresponding type is increased by one.
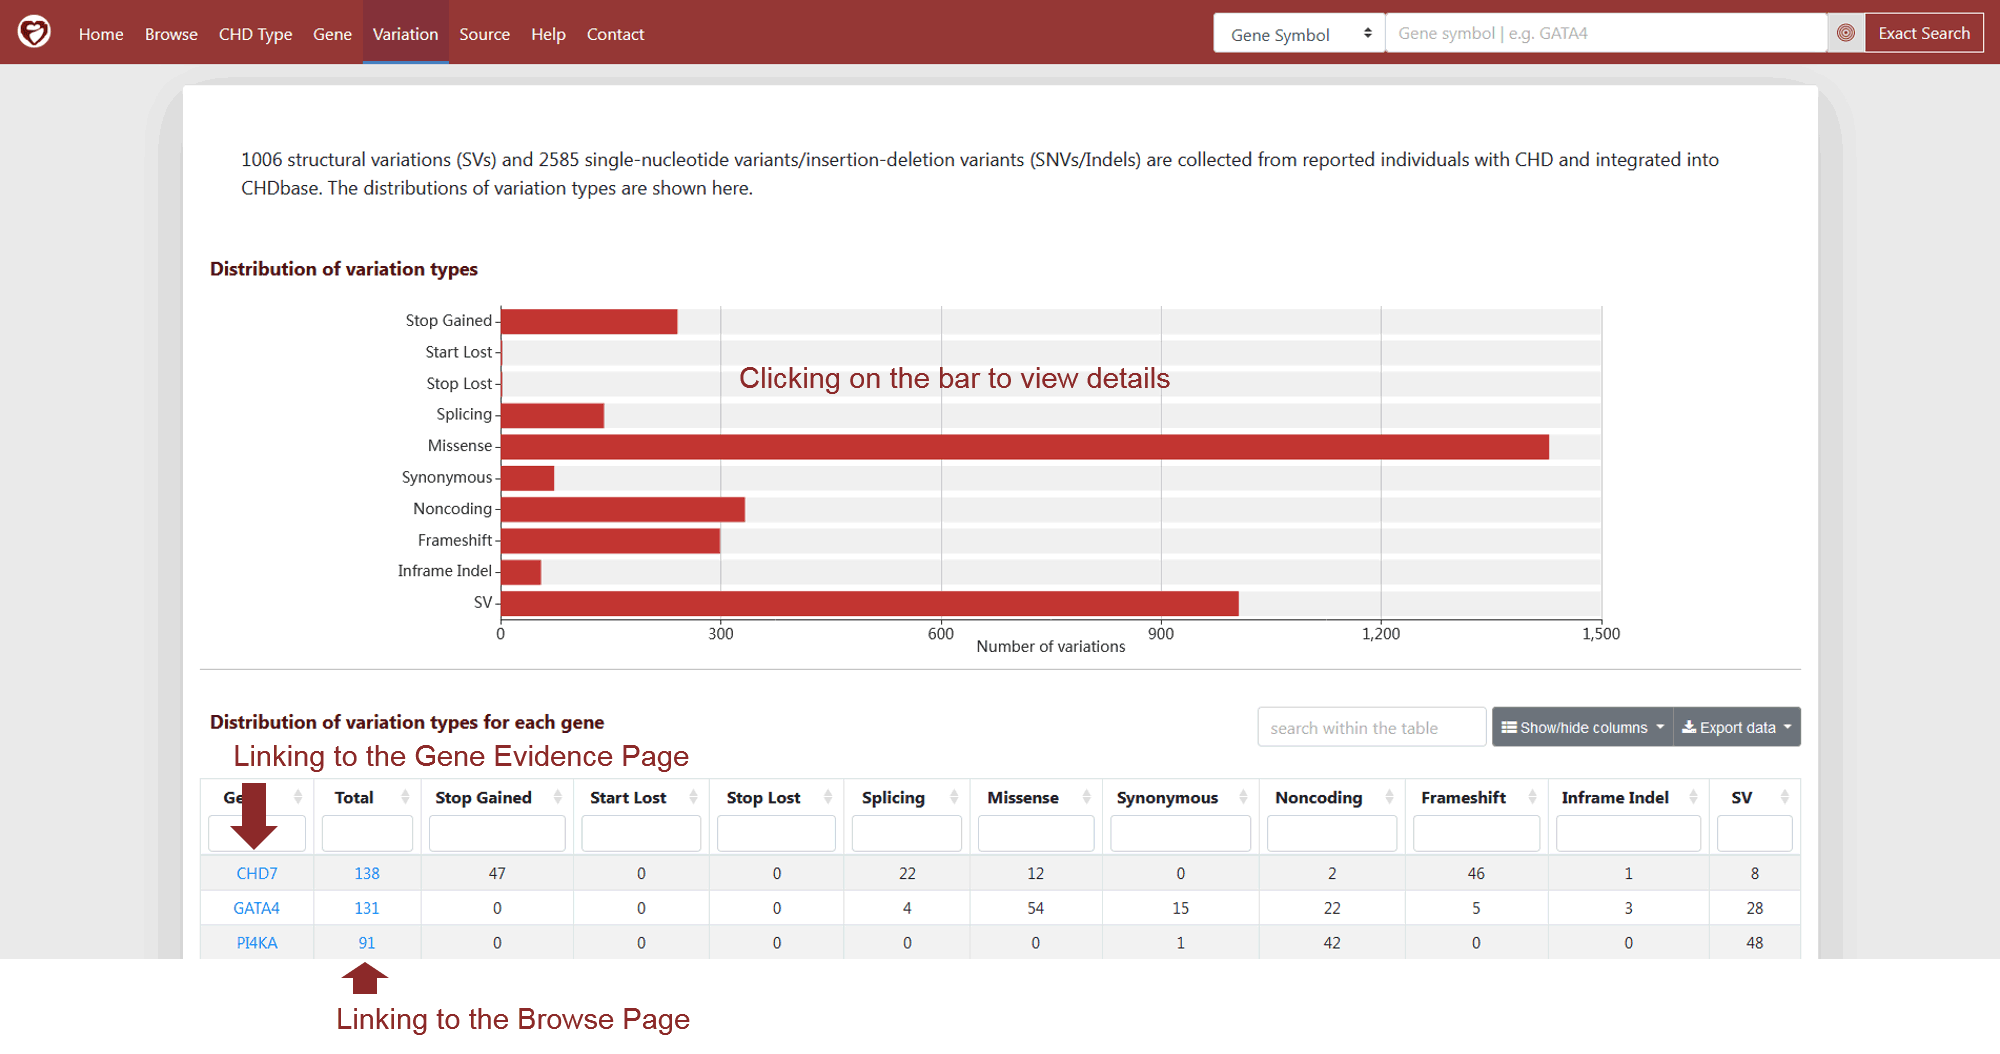
Figure 10 Variation Page
6.3.4 Source Page
A total of 1114 publications were manually curated into CHDbase. On Source Page, the number of publications is shown in the bar plot for each year of publication (Figure 11). The detailed information of these publications is provided in the table (Figure 11).
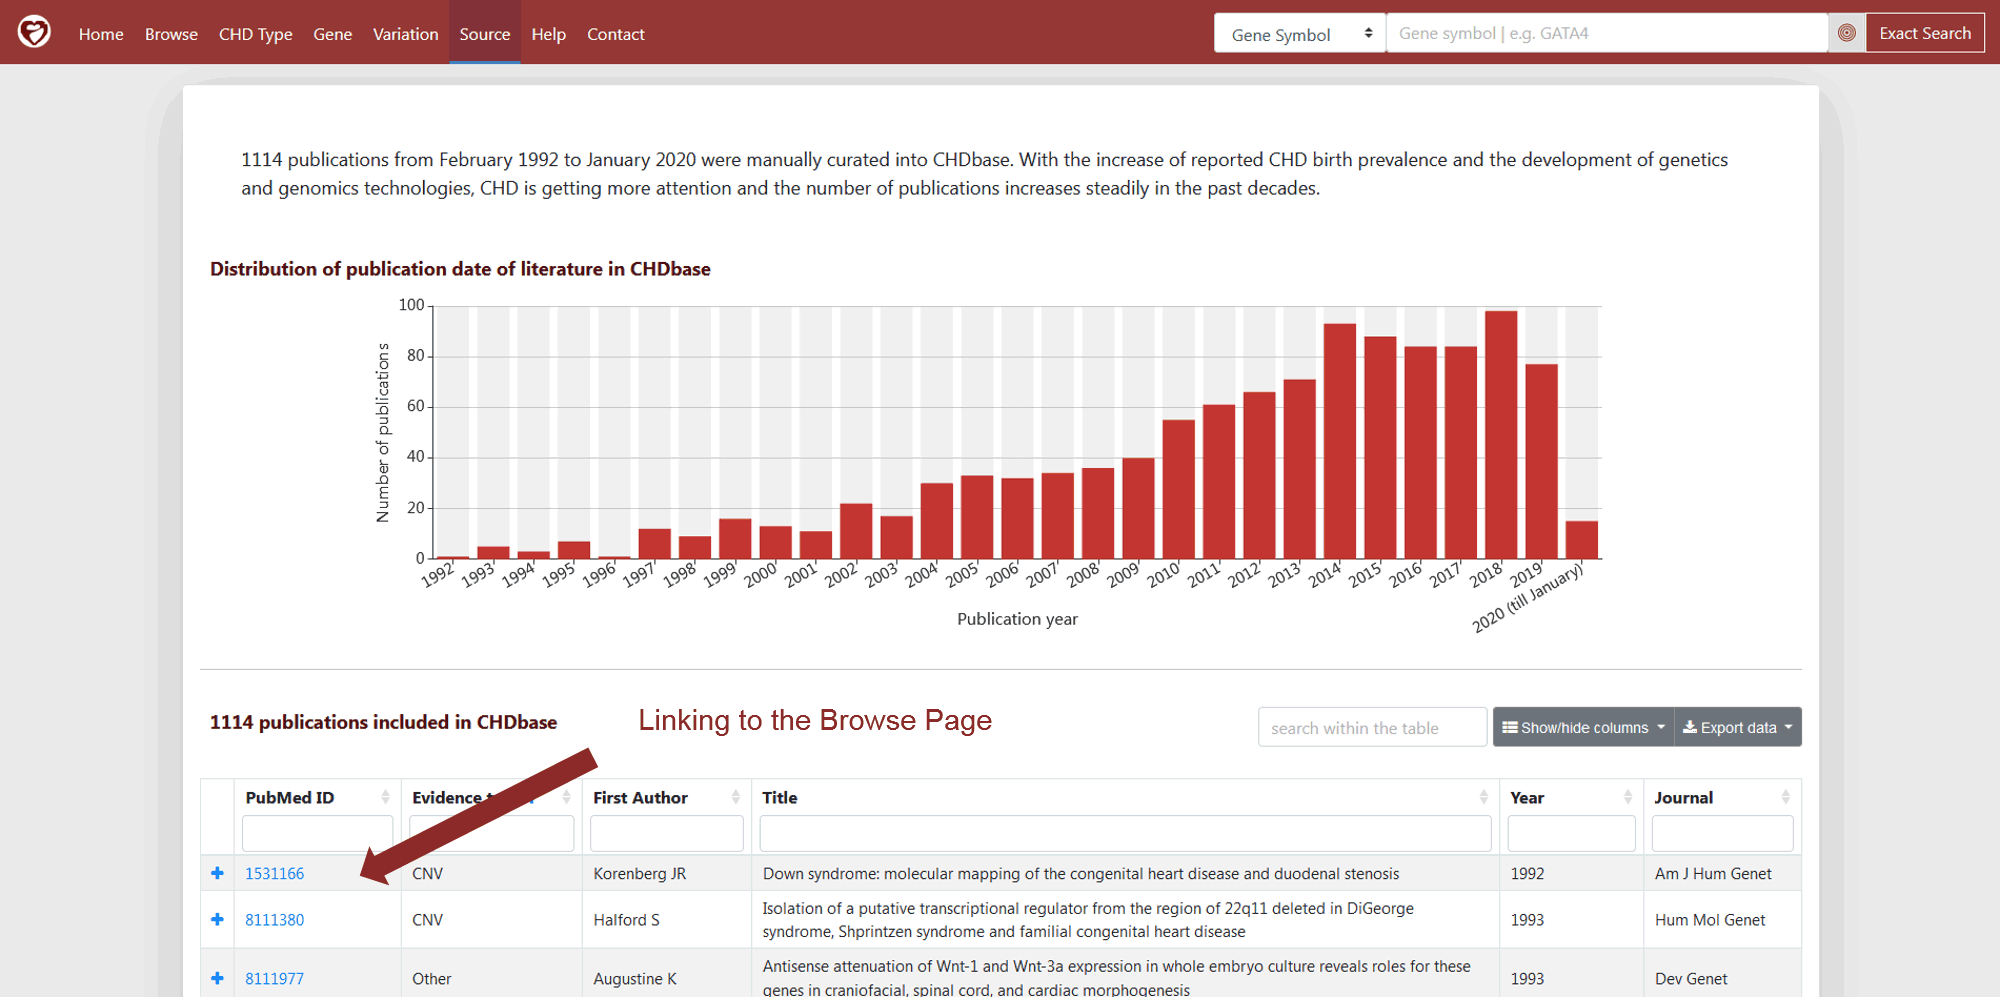
Figure 11 Source Page
7. Disease Abbreviation
| Abbreviation | Disease |
|---|---|
| AA | Aortic valvar atresia |
| APVC | Anomalous pulmonary venous connection |
| AR | Congenital aortic regurgitation |
| AS | Aortic stenosis |
| ASD | Atrial septal defect |
| ASI | Atrial situs inversus |
| AVS | Congenital aortic valvar stenosis |
| AVSD | Atrioventricular septal defect |
| BAV | Bicuspid aortic valve |
| BPV | Bicuspid pulmonary valve |
| cc-TGA | Congenitally corrected transposition of the great arteries |
| cAVJ | Common atrioventricular junction |
| CHD | Congenital heart defect |
| CoA | Coarctation of aorta |
| CTD | Cardiac conotruncal defects |
| DCM | Dilated cardiomyopathy |
| DCRV | Double-chambered right ventricle |
| DOLV | Double outlet left ventricle |
| DORV | Double outlet right ventricle |
| Dxc | Dextrocardia |
| d-TGA | D-Transposition of the great arteries |
| EA | Ebstein malformation of tricuspid valve |
| ECD | Endocardial cushion defect |
| HCM | Hypertrophic cardiomyopathy |
| HLHS | Hypoplastic left heart syndrome |
| HRHS | Hypoplastic right heart syndrome |
| HTX | Heterotaxy syndrome |
| IAA | Interrupted aortic arch |
| LSLs | Left-sided lesions |
| LSVC | Left superior caval vein |
| LVNC | Left ventricular non-compaction cardiomyopathy |
| LVOTO | Congenital left ventricular outflow tract obstruction |
| MA | Mitral atresia |
| MAPCAs | Major aortopulmonary collateral arteries |
| MR | Congenital mitral regurgitation |
| MVS | Congenital mitral valvar stenosis |
| OA | Overriding aorta |
| PA | Congenital pulmonary atresia |
| PAH | Pulmonary arterial hypertension |
| PA-IVS | Pulmonary atresia with intact ventricular septum |
| PAPVC | Partial anomalous pulmonary venous connection |
| PA-VSD | Pulmonary atresia with ventricular septal defect |
| PCD | Primary ciliary dyskinesia |
| PDA | Patent arterial duct |
| POF | Patent oval foramen |
| PS | Pulmonary stenosis |
| PTA | Persistent truncus arteriosus |
| PVS | Pulmonary valve stenosis |
| RAA | Right aortic arch |
| RAI | Right atrial isomerism |
| RVOTO | Congenital right ventricular outflow tract obstruction |
| SA | Single atrium |
| SV | Single ventricle |
| TA | Tricuspid atresia |
| TAPVC | Total anomalous pulmonary venous connection |
| TGA | Transposition of the great arteries |
| TOF | Tetralogy of Fallot |
| TR | Congenital tricuspid regurgitation |
| VCAb | Vena cava abnormality |
| VOTO | Congenital ventricle outflow tract obstruction |
| VSD | Ventricular septal defect |
